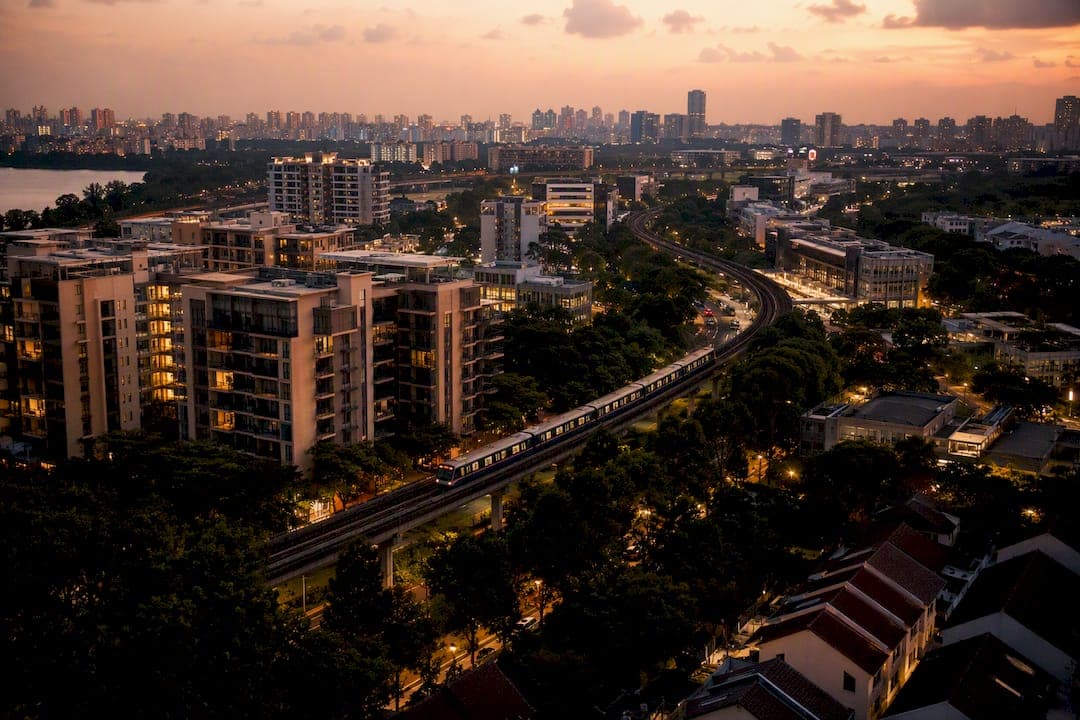
Seven zones deserve a closer look right now: Jurong, Woodlands, Paya Lebar/Geylang, Bayshore, Tengah, Bishan, and Clementi. Each shows some combination of a price gap to nearby new launches, rental yield running ahead of district averages, or a masterplan catalyst that hasn't been priced in yet.
The screen that finds these zones, and more like them, boils down to five checks run together: the price-per-square-foot gap against the nearest comparable new launch, rental yield versus the district average, transaction liquidity (how many units actually trade, not just how many are listed), proximity to a confirmed URA Master Plan catalyst, and the health of the remaining lease term. A zone that clears three or more of these is worth a file. A zone that clears all five and still trades at a discount is worth a serious look.
None of this replaces due diligence. It just tells you where to point the spreadsheet first.
Three moves to make this week:
- Run a URA transaction search for each candidate zone and pull the last 12 months of psf data by project.
- Check the current GLS pipeline for sites near your shortlist that could flood supply within 3 years.
- Pull HDB resale statistics for the estate to gauge upgrader demand feeding into nearby private stock.
Pro Tip: Screen for the gap first, then ask why it exists. The same discount tied to a permanently awkward layout or blocked view is just a fair price.
Key Takeaways
Identifying undervalued residential zones works best as a repeatable five-metric screen (price gap, yield, liquidity, catalyst proximity, and lease health) applied consistently across candidate precincts rather than relying on gut instinct.
| Point | Details |
|---|---|
| Screen five metrics together | Combine price gap, rental yield, transaction liquidity, catalyst proximity, and lease health rather than judging on one number alone. |
| Distinguish temporary from structural discounts | A price gap tied to financing cycles or a GLS supply wave can close; one tied to a poor location usually won't. |
| Match holding period to catalyst maturity | Long masterplan plays like Jurong or Tengah need 7 to 10 years; mature-estate plays like Bishan can work in 3 to 5. |
| Underwrite taxes and financing rules early | Factor ABSD, SSD, and TDSR limits into your cash and return calculations before, not after, you commit. |
| Verify catalysts with primary sources | Confirm every thesis against the URA Master Plan or an LTA announcement rather than secondhand claims. |
Primary Sources and Data Portals to Bookmark
- URA Master Plan for zoning and growth corridor designations.
- URA Residential Transaction Search and current GLS sites for pricing and supply pipeline data.
- HDB resale statistics for estate-level upgrader demand trends.
- MAS explainers on TDSR and MSR and IRAS guidance on ABSD and SSD for financing and tax modeling.
- Paid portals and automated yield calculators add speed once you've validated the basics manually; a site like Haio can help cross-check local transaction dashboards.
Cross-check every figure against at least two sources before you act on it.
Table of Contents
- Why Some Residential Zones Trade Below Fair Value Right Now
- What Does "Undervalued" Actually Mean in This Market?
- Which Zones Show the Clearest Signs of Being Undervalued?
- How Do You Actually Run This Screen Yourself?
- What Calculations Should You Run Before Committing Capital?
- How a Transit Catalyst Actually Reshapes a Precinct's Value
- An Investor Playbook Built on Data, Not Instinct
- Sources
- FAQ
Why Some Residential Zones Trade Below Fair Value Right Now
Undervaluation in Singapore's property market rarely comes from a single cause. It's usually a stack of temporary frictions sitting on top of a genuine long-term catalyst, and most buyers only see the frictions.
Financing costs are the biggest current friction. The Total Debt Servicing Ratio framework caps how much of a borrower's income can go toward debt repayments, which tightens the buyer pool whenever rates sit elevated. Fewer qualified buyers means slower absorption, and slower absorption shows up as flat or falling psf in zones that otherwise have solid fundamentals. That's precisely the window a patient investor wants: demand hasn't vanished, it's just been rationed by financing rules that eventually ease.

Cooling measures work the same way. Additional Buyer's Stamp Duty) scales by buyer category and pushes up-front cash requirements high enough to sideline speculative flippers, which thins out short-term trading volume in emerging zones. That thinner volume can look like weak demand when it's actually just weak speculation. Genuine long-term demand, tracked through owner-occupier transactions and rental absorption, tells a different story in several of the zones covered later.
The supply side matters just as much. The Government Land Sales pipeline shows where new private housing stock is coming, and a zone with a large GLS release scheduled for the next 18 months will usually see resale prices stay soft until that supply clears. That's not the same as a zone being cheap. It's a zone that might get cheaper before it gets more expensive, which changes your entry timing more than your thesis.
The gap between a temporarily discounted zone and a permanently discounted one almost always comes down to one question: is the constraint holding prices down a financing cycle, a supply glut, or a structural flaw in the location itself? Only the first two resolve on their own.
For an investor, this means underwriting on a longer runway than the current rate cycle. A zone priced cheap because TDSR is biting hard this year could reprice meaningfully once rates ease or incomes catch up, but only if the location's underlying demand drivers, jobs, transit, schools, are intact. Model your holding period assuming today's financing friction eases over 3 to 5 years, not that it disappears next quarter.
What Does "Undervalued" Actually Mean in This Market?
"Undervalued" isn't a feeling. It's a measurable gap between what a unit trades for and what comparable stock, adjusted for location quality and lease term, should command. Treat it as a scorecard, not a vibe.
Five metrics do most of the work. Each one is cheap to check using public data, and together they separate a real opportunity from a zone that's cheap because something is structurally wrong with it.
| Metric | Why it matters | Practical screening threshold |
|---|---|---|
| Price gap to nearest new launch | Shows how much of a discount the resale or older-launch stock carries versus fresh supply in the same catchment | A gap above typical thresholds, adjusted for age and finishes, flags a candidate worth investigating |
| Rental yield vs. district average | Signals whether tenant demand is outpacing what the sale price implies | Yield running noticeably above the district average is a meaningful positive signal |
| Transaction volume trend | Distinguishes illiquid dead zones from precincts where buyers are quietly returning | Volume below the 3-year average but trending upward over the last 2 to 3 quarters |
| Lease years remaining | Determines how much of the price gap reflects tenure decay versus genuine mispricing | Remaining lease years below a recognized threshold typically reflect accelerated decay, meaning discounts often signal fair pricing rather than opportunity |
| Catalyst proximity | Confirms a credible reason for future revaluation rather than a permanent discount | Proximity within a designated growth corridor or rail interchange named in the URA Master Plan or an LTA rail announcement |
How you weight these five depends on what you're actually optimizing for. If your goal is rental income, put more weight on yield and transaction depth. Those two tell you whether tenants exist and whether you could exit if you needed to. If your goal is capital appreciation over a 7 to 10 year horizon, weight the catalyst proximity and price gap more heavily; yield becomes a secondary consideration that just needs to cover your holding costs.
Red flags matter as much as the green lights. A precinct with lease years dipping below the mid 60s combined with a large GLS site scheduled to release within 2 years is a double warning: you're paying decay-adjusted prices today for a location that could see fresh competing supply before your thesis plays out. Weak tenant pools, evidenced by long vacancy periods on rental portals or a shallow pool of comparable rented units, should also knock a candidate down your list regardless of how attractive the psf gap looks on paper.
Pro Tip: Convert every leasehold price into an effective cost per remaining lease year (purchase price divided by years left) rather than comparing raw psf across units with different tenure. A $1,200 psf unit with 90 years left and a $1,050 psf unit with 55 years left are not the same trade, and the raw numbers hide that completely.
Which Zones Show the Clearest Signs of Being Undervalued?
Here's the shortlist, area by area, with the thesis, the supporting signals, the catalysts, and the risks that could derail each one.
Jurong: the second-CBD long play
The thesis here is straightforward: Jurong Lake District is being built out as a second central business district, and prices haven't fully caught up to that designation yet. This is positioned as a long-horizon growth story tied directly to the masterplan, and it typically needs 7 to 10 years to fully play out.
- Price gap: resale stock in the surrounding precincts still trades at a discount to psf levels seen closer to established CBD fringe locations.
- Rental yield signal: yields have held up reasonably given the existing business park tenant base, even before the full office and commercial buildout lands.
- Transaction momentum: volume has been steady rather than explosive, consistent with a catalyst still years from maturity.
Catalysts: the ongoing Jurong Lake District masterplan buildout, and continued rail connectivity investment tied into the Master Plan's growth corridor designations. Risks: this is a genuinely long hold, and a lot can shift in a decade, including the pace of commercial buildout and competing GLS releases nearby. Suggested holding period: 7 to 10 years. First move: pull transaction history for the district over the last 5 years to see whether psf has already started climbing ahead of the masterplan completion, which would mean you're arriving late.
Woodlands: the northern gateway with a financing tailwind
Woodlands benefits from its role as a regional center and its proximity to the Causeway, which supports a resilient tenant base of cross-border workers alongside local demand. The price gap versus more central OCR precincts remains wide, and rental yields tend to run higher here precisely because entry prices are lower.
- Price gap: consistently among the more affordable OCR precincts on a psf basis.
- Rental yield signal: yields often outperform the broader OCR average given the lower entry cost relative to rent achieved.
- Transaction momentum: steady HDB upgrader flow feeds private resale demand as flat owners look to move up.
Catalysts: continued regional center development and any confirmed rail enhancements affecting north-south connectivity. Risks: heavy reliance on cross-border commuting patterns that can shift with policy changes, and a meaningful GLS pipeline that could add supply faster than absorption. Suggested holding period: 5 to 7 years. First move: check HDB resale statistics for the estate to confirm upgrader momentum is real and not a one-quarter blip.
Paya Lebar/Geylang: fringe-CBD pricing at a discount
This pairing sits closer to the city center than its pricing often suggests, largely because Geylang still carries some reputational drag from its historic red-light district association. That perception gap is exactly what creates the opportunity for buyers willing to look past it.
- Price gap: notably wide versus comparable Rest of Central Region (RCR) stock, given the actual distance to the CBD.
- Rental yield signal: strong, driven by proximity to Paya Lebar's commercial hub and MRT interchange.
- Transaction momentum: pockets of the district trade actively, particularly closer to the Paya Lebar Quarter commercial cluster.
Catalysts: continued commercial development around the Paya Lebar interchange and gradual residential upgrading spreading from adjacent estates. Risks: the perception discount on the Geylang side can be sticky longer than the fundamentals justify, and micro-location matters enormously here, block by block. Suggested holding period: 5 to 7 years. First move: narrow your transaction search to streets within a 10 minute walk of Paya Lebar MRT specifically, rather than treating the whole planning area as one unit.
Bayshore: coordinated masterplanning with near-term supply noise
HDB has published a formal masterplan for the Bayshore estate, which is one of the clearer public signals an investor can act on. Coordinated public planning like this tends to lift surrounding private resale values once construction visibly progresses, but it can also mean a wave of new supply that temporarily depresses nearby psf.
- Price gap: existing private stock near the estate trades below what comparable coastal-adjacent precincts elsewhere command.
- Rental yield signal: still developing, since the tenant base here is thinner until the estate matures.
- Transaction momentum: currently modest, which is typical ahead of a masterplan's construction phase.
Catalysts: the HDB masterplan itself, plus any waterfront or park connector enhancements tied to the East Coast corridor. Risks: the masterplan's own construction phase could flood the immediate area with competing new supply before your resale unit appreciates, so timing your entry against the delivery schedule matters more here than almost anywhere else on this list. Suggested holding period: 7 to 10 years. First move: map the masterplan's phased delivery timeline against your intended purchase and exit windows before committing capital.
Tengah: the forest town play for patient capital
Tengah is Singapore's newest town, built around a car-light, forest-integrated design. Because it's still filling out, comparable transaction data is thinner than in mature estates, which is precisely why fewer investors have properly underwritten it yet.
- Price gap: limited direct comparables exist, but early private launches near Tengah have priced at a discount to similarly positioned OCR new towns with more established infrastructure.
- Rental yield signal: not yet mature, since the resident and tenant base is still growing.
- Transaction momentum: low by definition at this stage, but climbing as more blocks complete and residents move in.
Catalysts: the full town buildout, new MRT stations serving the estate, and the broader jobs corridor planned nearby. Risks: this is the most speculative entry on this list. Thin transaction history makes it genuinely hard to verify pricing, and the town's full amenity buildout is still years away. Suggested holding period: 7 to 10 years, and only for capital you can afford to have illiquid for that stretch. First move: track completion milestones against the town's masterplan rather than trying to force psf comparisons that don't yet have a solid data base.
Bishan: mature estate, quietly resilient demand
Bishan is already an established, well-regarded central-ish estate with strong schools and an MRT interchange, which means it rarely shows up on anyone's "undervalued" list at first glance. The opportunity here is narrower and more surgical: specific older private stock trading at a discount to newer launches in the same catchment, purely because of building age rather than location quality.
- Price gap: older private developments trade meaningfully below newer launches within the same planning area.
- Rental yield signal: solid and consistent, underpinned by school proximity and interchange access.
- Transaction momentum: steady, reflecting Bishan's status as an established, liquid market rather than an emerging one.
Catalysts: any redevelopment or en bloc activity affecting older blocks, plus continued demand from families prioritizing the school catchment. Risks: this is a narrower play than the other zones on this list. It works on specific aging developments rather than the whole precinct, and you need to check individual building condition and any looming maintenance costs. Suggested holding period: 3 to 5 years, shorter than most entries here given the estate's already-mature demand base. First move: compare psf across every private development in the planning area by completion year to isolate which specific buildings carry the widest age-adjusted discount.
Clementi: education-anchored demand with connectivity upside
Clementi's appeal rests on a durable combination: proximity to the National University of Singapore campus cluster, strong schools, and an MRT interchange. That combination has historically supported rental demand that holds up better than most OCR precincts during softer market cycles.
- Price gap: pockets of older private stock still trade at a discount versus nearby newer completions, particularly units further from the interchange.
- Rental yield signal: consistently strong, driven by student and staff rental demand tied to the university cluster.
- Transaction momentum: reliable, with Clementi rarely experiencing the deep liquidity droughts seen in newer, less established zones.
Catalysts: any further connectivity enhancements and continued institutional expansion in the education cluster. Risks: much of the value here is already recognized by the market, so the discount window is narrower than in Tengah or Bayshore, and it can close faster once identified. Suggested holding period: 5 to 7 years. First move: focus your transaction search on units within a 400 meter radius of the MRT interchange, where the yield premium tends to concentrate most tightly.
How Do You Actually Run This Screen Yourself?
The method behind the shortlist above is fully repeatable. It doesn't require paid software, though paid tools speed things up once you've validated the basics manually.
- Pull raw transaction data. Start with URA's Residential Transaction Search for every project in your candidate zone over the trailing 24 months, and export psf by transaction date.
- Check the supply pipeline. Cross-reference against the current GLS site list to flag any large parcels near your candidate that could release competing new supply within 3 years.
- Layer in HDB demand signals. Where a zone sits near HDB estates, pull resale statistics to gauge upgrader momentum feeding private demand.
- Calculate the psf gap. Compare trailing resale psf against the most recent comparable new launch in the same catchment, adjusted for building age and finishes.
- Compute rolling rental yield. Use recent rental transactions (available through the same URA portal) against your assumed purchase price to estimate gross yield, then compare it to the district average.
- Walk the precinct. Note amenity density, foot traffic patterns, noise or construction disruption, and anything that doesn't show up in a spreadsheet but would affect a tenant's or buyer's decision.
- Confirm the catalyst. Check the URA Master Plan and any LTA rail announcements to verify a credible, dated reason for future revaluation exists.
A first-pass screen across 3 to 4 candidate zones can realistically be done in a weekend using only free public data. Full underwriting on a specific unit, including legal checks, a proper valuation, and financing pre-approval, typically takes 2 to 4 weeks and may justify a modest fee for a conveyancing lawyer or a paid comparables tool if you're moving on multiple deals at once.
- Avoid overfitting to a single quarter's data. A 3 month spike or dip in transaction volume often reflects one large project completing, not a market shift.
- Always compare like with like: match tenure type, unit size band, and building age before drawing conclusions from a psf gap.
- Cross-check any single data source against at least one other before acting on it.
What Calculations Should You Run Before Committing Capital?
Finding a candidate zone is the easy part. Validating a specific unit inside it is where most investors either make money or quietly lose it over several years of underwhelming returns.
Start with a break-even calculation: total acquisition cost (purchase price, ABSD if applicable, legal fees, renovation) divided by expected monthly rent gives you a rough payback horizon before factoring in appreciation. Then run a yield-to-hold figure: net rental income after maintenance, property tax, and mortgage servicing, expressed as a percentage of your actual cash invested rather than the full purchase price. Cash invested, not purchase price, is the number that tells you your real return.
Stress-test both interest rates and vacancy together, not separately. A simple sensitivity check might look like this: if rent falls 3% while your mortgage rate rises 1 percentage point, does the unit still cover its holding costs from rental income alone, or does it require you to top up from savings every month? Most investors only stress-test one variable at a time and get blindsided when both move against them simultaneously, which happens more often than the isolated scenarios suggest.
Run your red-flag checklist before you get emotionally attached to a unit:
- Remaining lease dips below roughly 60 years, which accelerates value decay and complicates future CPF usage for a buyer down the line.
- A large GLS site sits within a 10 minute walk and is scheduled to complete within 3 years of your intended purchase.
- The layout requires expensive structural renovation to be rentable at a competitive rate.
- The visible tenant pool for comparable units in the building has been thin or slow to fill over the past 6 to 12 months.
Model your taxes properly rather than as an afterthought. ABSD varies by buyer profile and hits your upfront cash requirement hard, while Seller's Stamp Duty penalizes an exit within the first few years of ownership, which should push your minimum holding period out rather than leaving it open ended. If you're planning to use CPF funds, check the current CPF usage limits early, since they cap how much of your purchase can be funded that way and directly affect how much cash you need to bring to the table.
How a Transit Catalyst Actually Reshapes a Precinct's Value
Consider how a precinct built directly around a transit interchange typically plays out over time, because the pattern repeats across multiple Singapore locations and it's instructive regardless of which specific zone you're evaluating.
The sequence usually runs the same way. Early in the process, before construction visibly starts, the precinct trades at a discount to comparable locations because the catalyst is still a line item in a masterplan document rather than a lived reality. Once construction begins and residents can see cranes and hoardings, sentiment shifts, but prices often lag that sentiment shift by a year or two because transaction data takes time to reflect changed expectations. By the time the interchange or mixed-use development opens, much of the repricing has already happened, and the remaining upside comes from continued tenant and buyer demand maturing around the new infrastructure.
The mistake most investors make with transit-led catalysts is waiting for the ribbon-cutting to buy in. By then, the price gap that made the zone attractive in the first place has usually already closed.
This is exactly the dynamic behind integrated developments that combine residential, retail, and transit access in one precinct. Hougang Central Residences sits directly above Hougang MRT station, integrated with a retail mall and bus interchange, and positioned near the future Cross Island Line interchange, the kind of layered rail development connectivity that historically supports long-term demand once fully operational. Track median psf, transaction volume, and rental rate trends over successive quarters, rather than a single data point, to confirm a catalyst like this is actually taking effect rather than just being anticipated.
An Investor Playbook Built on Data, Not Instinct
Most advice on finding undervalued zones stops at "look for infrastructure upgrades," which is true but nearly useless without a way to measure whether the market has already priced that upgrade in. The real judgment call isn't spotting a catalyst. It's figuring out how much of that catalyst's future value is already baked into today's psf.
Conventional wisdom also overrates simple price comparisons and underrates lease decay. Two units at the same psf with a 30 year difference in remaining lease are not comparable investments, yet plenty of buyers still shop this way. Convert to cost per remaining lease year and the picture changes fast.
If you take one thing from this framework, prioritize transaction liquidity over headline price. A zone that's cheap because nobody wants to buy there yet is a very different bet from a zone that's cheap because supply briefly outran demand. The first is a value trap; the second is timing. Learn to tell them apart before you learn anything else about a candidate zone.
This article is general information, not a substitute for advice from a qualified financial advisor. Consult a qualified financial professional about your own circumstances before acting on anything here.
Sources
- MAS — Calculating TDSR for property loans
- URA — Master Plan
- LTA — Next phase of rail development (2026 news release)
- HDB — Resale statistics
FAQ
How Do You Find Undervalued Property in a Market Like This?
Screen candidate zones against five metrics together: price gap to new launches, rental yield versus the district average, transaction liquidity, proximity to a confirmed URA Master Plan catalyst, and remaining lease health. Zones clearing three or more of these merit deeper research.
Which Residential Area Is Generally the Most Affordable?
Among the zones covered here, Woodlands and Tengah tend to show the widest price gaps versus more central OCR precincts, though affordability always needs to be weighed against the maturity of the surrounding tenant and amenity base.
What Makes a Condo "Undervalued" Rather Than Just Cheap?
An undervalued unit shows a measurable price gap versus comparable stock while still clearing lease health and demand thresholds; a cheap unit usually has a structural flaw, like severe lease decay or a genuinely weak location, that explains the discount permanently.
Which Residential Area Is Considered the Strongest Overall Choice?
There's no single best district; the right pick depends on whether you're optimizing for yield or long-term appreciation, with RCR locations often balancing both while OCR zones tend to offer higher initial yields.
How Long Should You Plan to Hold an Undervalued Zone Investment?
Long masterplan plays like Jurong or Tengah typically need 7 to 10 years for the thesis to mature, while more established estates like Bishan or Clementi can produce results over a shorter 3 to 5 year window.